🎉 Butler 9.0 - Monitoring Windows services
With Butler 9.0 it's easy to monitor Windows services, which combined with the already existing reload task monitoring makes Butler a comprehensive solution for high-availability Qlik Sense solutions.


Butler 9.0 is out - available from the release page on GitHub.
Documentation is available at butler.ptarmiganlabs.com.
This version brings both new features and simplified setup of Butler itself.
As indicated by the shift from version 8.x to 9.0, it is a major upgrade both in terms of new features and in the sense that the structure of the config file has changed slightly. More on that below.
Monitoring Windows services
Monitoring Windows services is useful because it provides real-time visibility into the availability status of the services (up or down).
If we can also get notifications when a service stops (or starts) running we can act immediately and hopefully bring the service back to normal operation quickly.
This holds true for both the Windows services that make up client-managed Qlik Sense Enterprise as well as other mission critical services.
Starting with version 9.0, Butler can monitor Windows services on the same or other servers. A couple of conditions apply:
- Butler itself has to be running on Windows for the services monitoring to work.
- If services on remote servers are to be monitored, there has to be network connectivity to that server from the server where Butler is running (of course...)
Alert destinations
The following alert destinations are supported to begin with:
- InfluxDB. Combined with Grafana this gives us very nice status dashboards, see below 👇.
- New Relic. Service status can be sent as both events and log entries to New Relic. Example 👇 and here.
- Email. See below.
- Microsoft Teams. Example here.
- Slack. Example here.
- MQTT. Example here.
- Outbound webhooks (=http calls). Example here.
Information about what information is sent to each destination is available at butler.ptarmiganlabs.com.
Show me the alerts
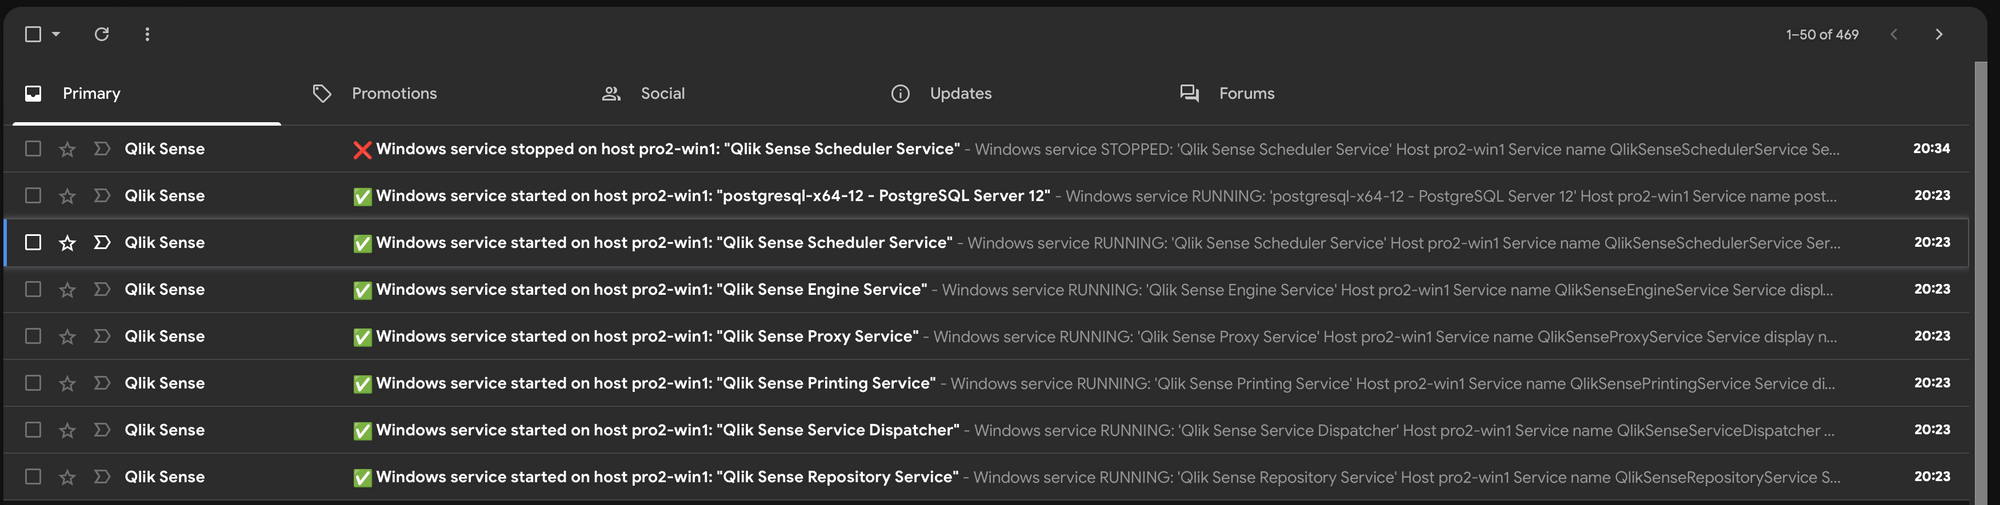
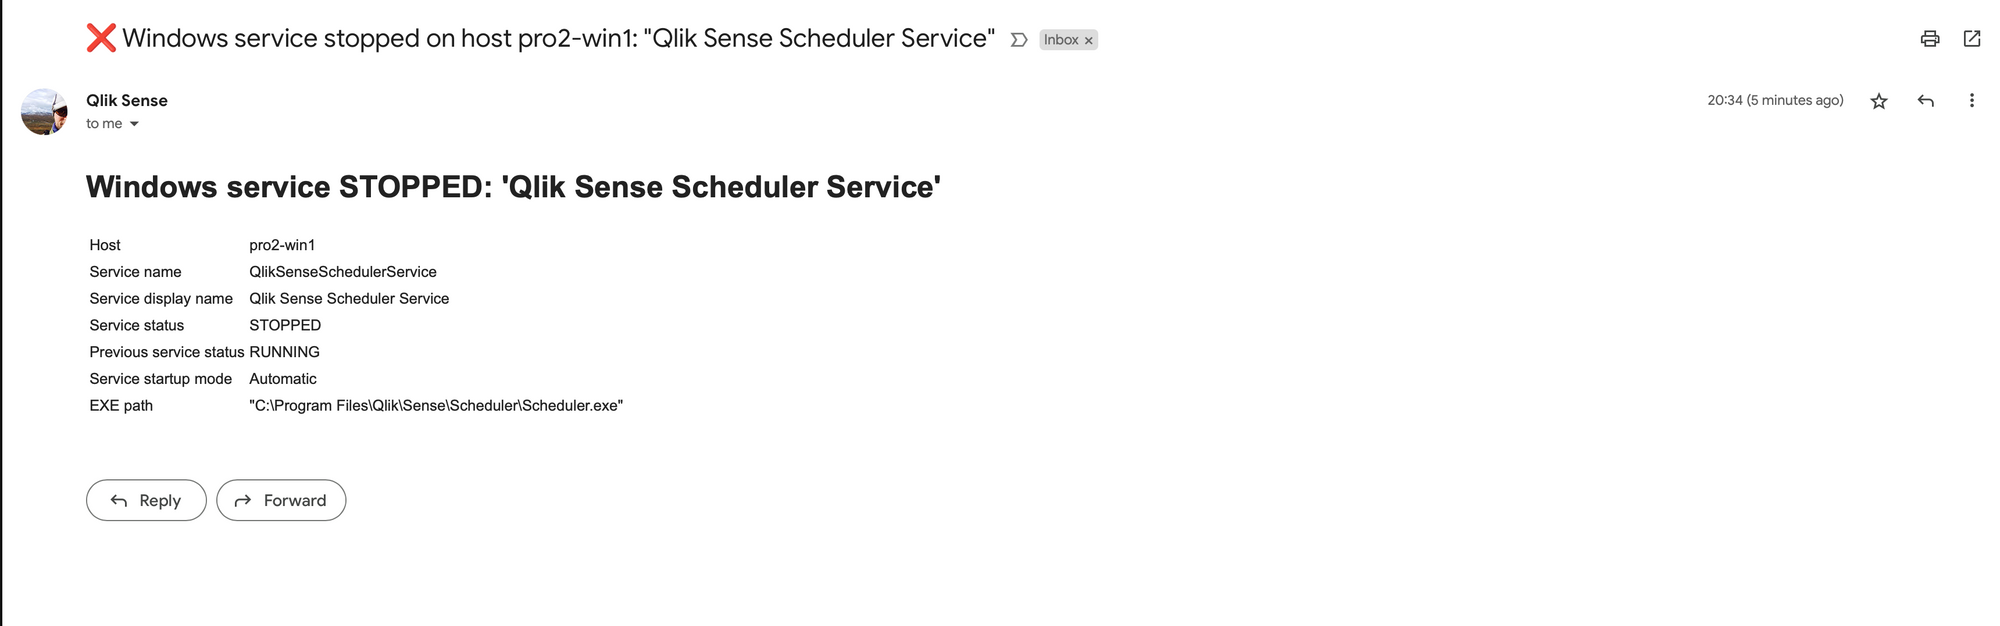
Service related alerts sent as emails can look like this:
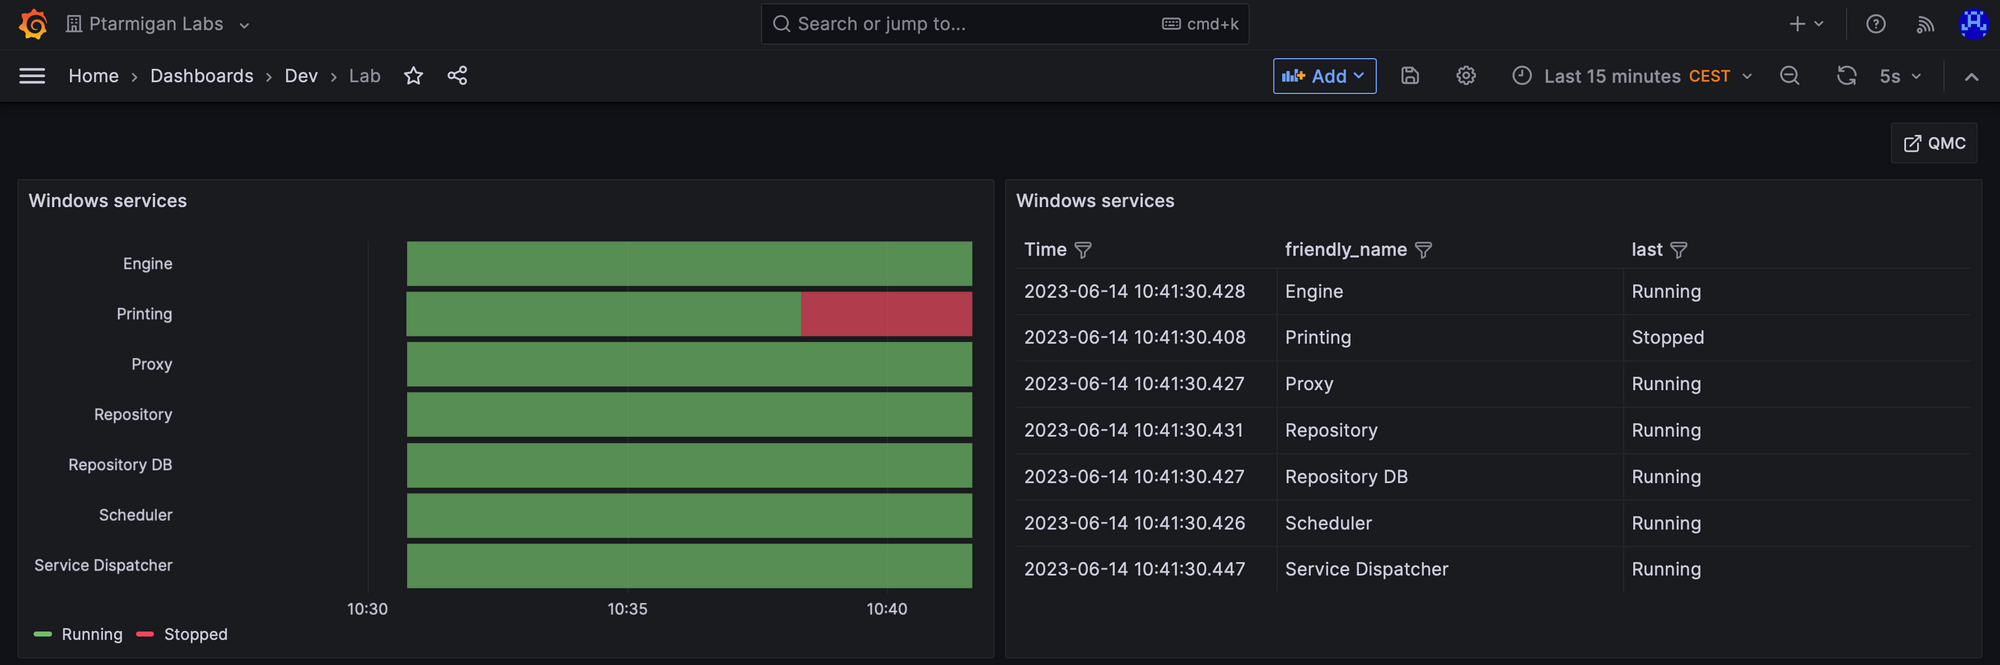
After storing the alerts in InfluxDB they can be visualised in Grafana dashboards:
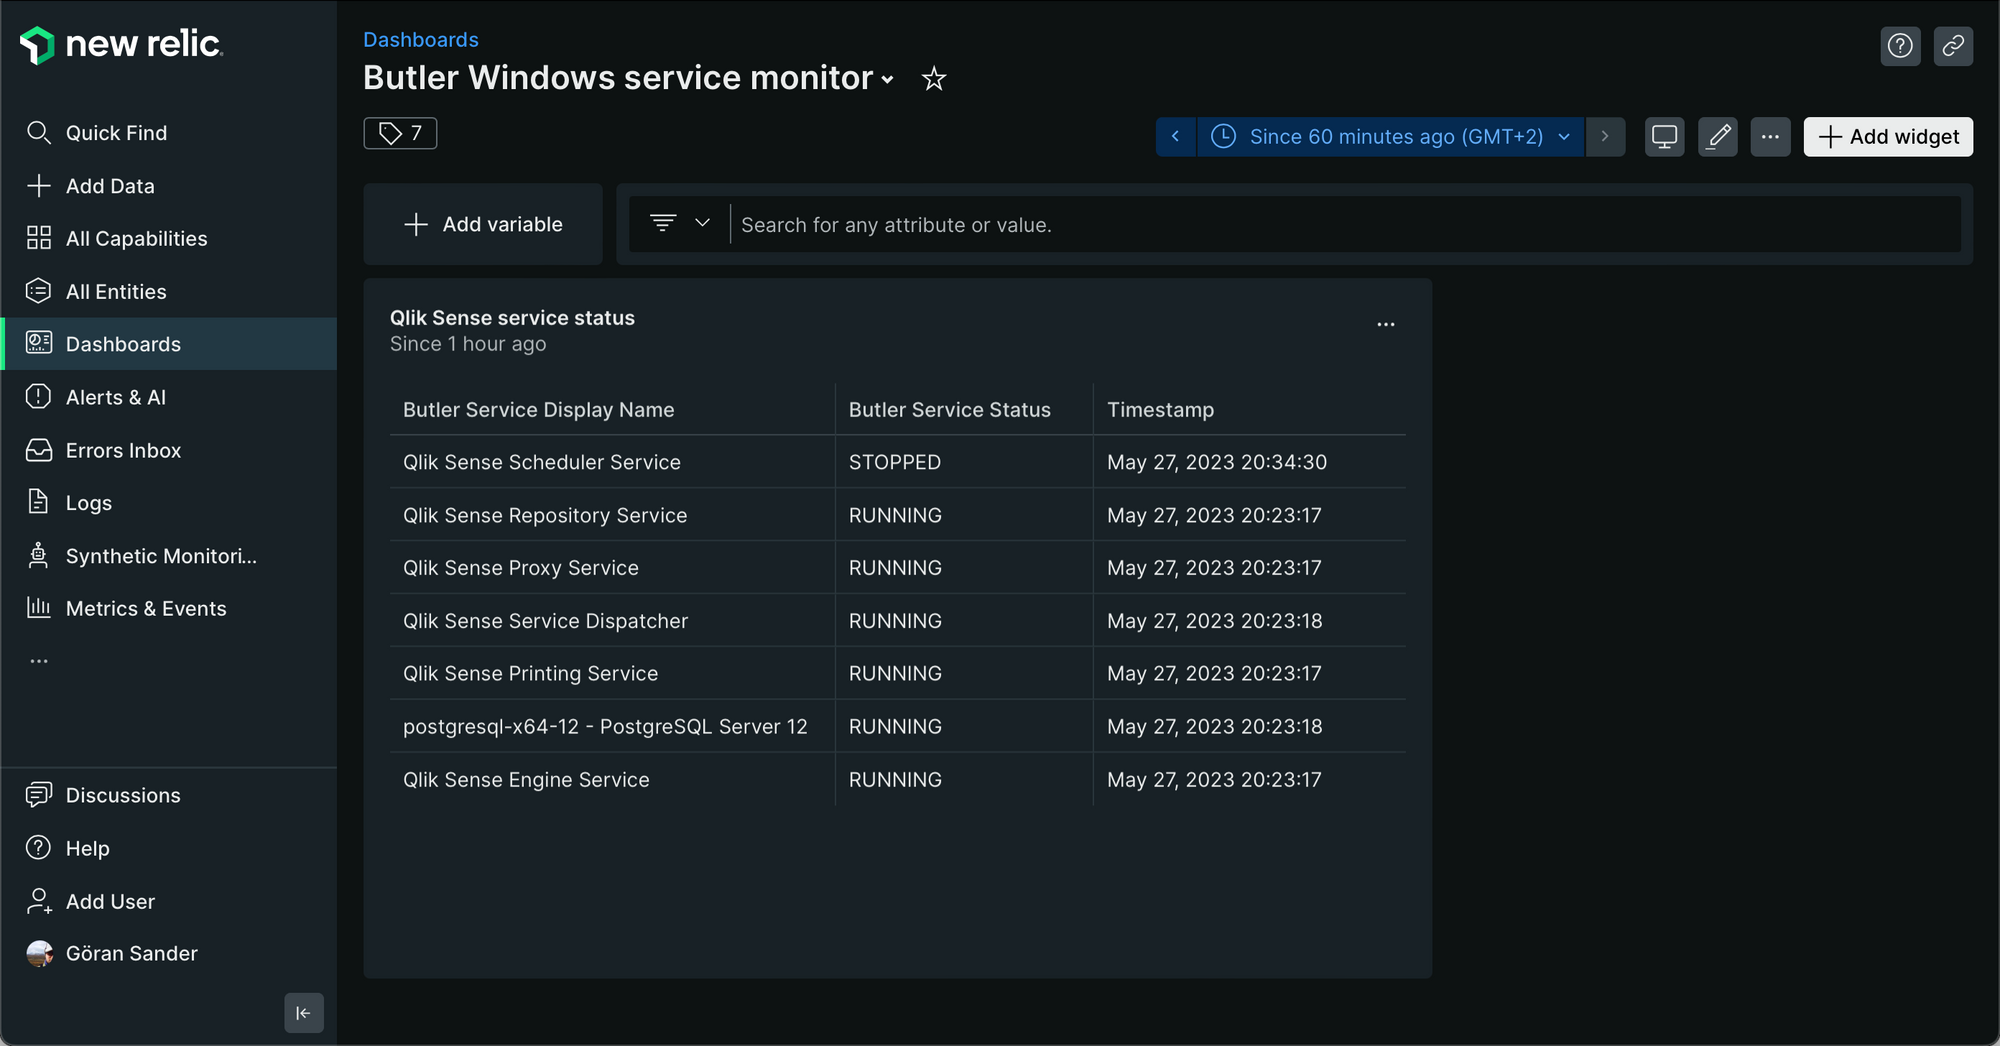
...or in a New Relic dashboard (not quite as nice visuals as in Grafana though):
Getting started
Setting up services monitoring is done in Butler's config file, just as all other features. In this example we are monitoring all Qlik Sense services and sending alerts to all destinations:
Butler:
  ...
  ...
  # Monitor Windows services.
  # This feature only works when Butler is running on Windows Server or desktop.
  # On other OSs service monitoring will be automatically disabled.
  serviceMonitor:
    enable: false                    # Main on/off switch for service monitoring
    frequency: every 30 seconds     # https://bunkat.github.io/later/parsers.html
    monitor:
      - host: <hostname or IP>      # Host name of Windows computer where services are running
        services:                   # List of services to monitor
          - name: postgresql-x64-12       # Posgress/repository db
            friendlyName: Repository DB
          - name: QlikSenseEngineService
            friendlyName: Engine
          - name: QlikSensePrintingService
            friendlyName: Printing
          - name: QlikSenseProxyService
            friendlyName: Proxy
          - name: QlikSenseRepositoryService
            friendlyName: Repository
          - name: QlikSenseSchedulerService
            friendlyName: Scheduler
          - name: QlikSenseServiceDispatcher
            friendlyName: Service Dispatcher
    alertDestination:               # Control to thich destinations service related alerts are sent
      influxDb:                     # Send service alerts to InfluxDB
        enable: true
      newRelic:                     # Send service alerts to New Relic
        enable: true
      email:                        # Send service alerts as emails
        enable: true
      mqtt:                         # Send service alerts as MQTT messages
        enable: true
      teams:                        # Send service alerts as MS Teams messages
        enable: true
      slack:                        # Send service alerts as Slack messages
        enable: true
      webhook:                      # Send service alerts as outbound webhooks/http calls
        enable: true
  ...
  ...
Configuration of the various alert destinations is done in their respective parts of the config file.
Configuration sanity check
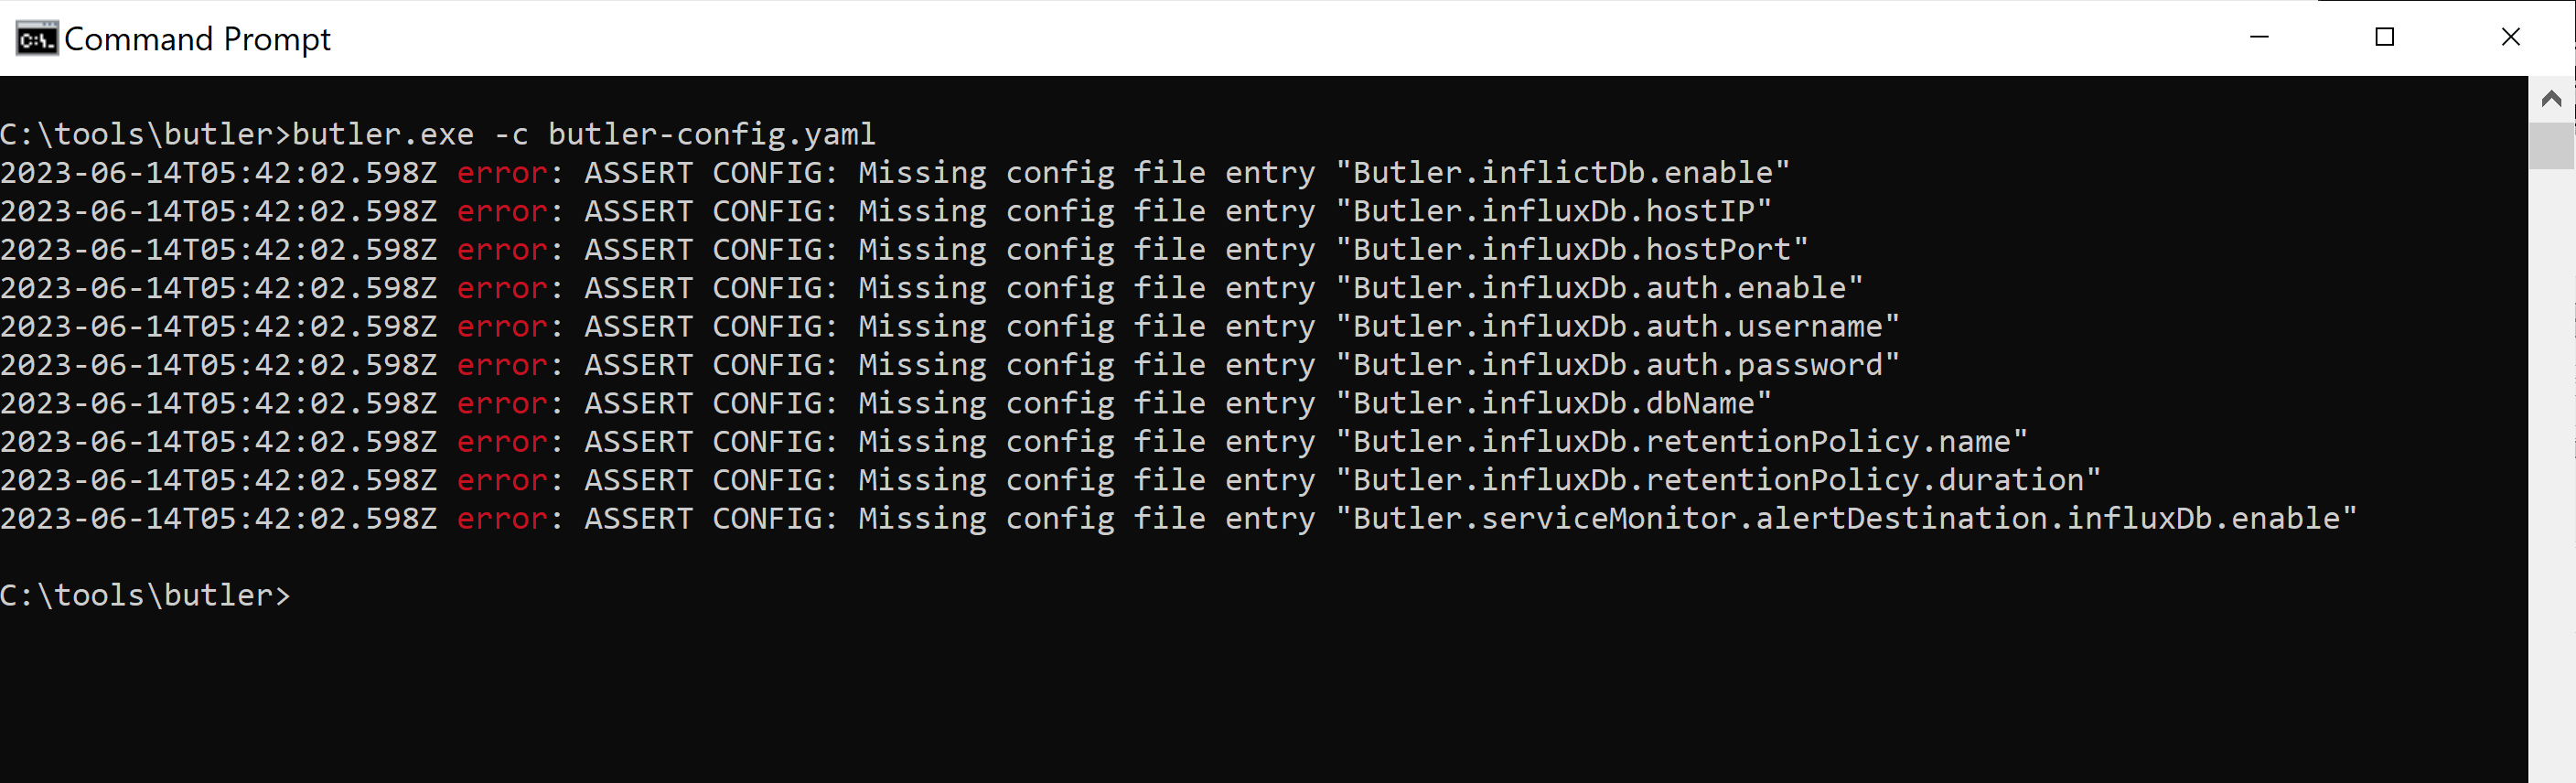
The second major change is related to Butler's config file, which is in YAML format.
Butler version 9.0 and later will do extensive checks to ensure that the config file has the correct structure and that the expected config entries are there.
If some entries are not present Butler will show what's missing and abort.
Add the missing config entries and try again.
This means that all config entries are now mandatory.
Easiest way to get started is to base your Butler configuration on the provided template config file - this will ensure you use a correctly structured config file.