
Enhanced monitoring of Netgear ReadyNAS RN312 using Monitorix

Edit: Some additional configuration turned out to be necessary to achieve stable operation, see this post.
The built-in monitoring of the RN312 is ok for basic purposes, but still pretty limited.
I am really heading towards a Zabbix setup (I think at least, having tested it in a VM environment it seems pretty nice), but there is A LOT of configuration needed to get Zabbix up and running. That’s actually a downside of Zabbix: In order to get simple things like alarm/notification emails set up, you need to do a lot of configuration in the web UI. Yes, it is very flexible, but also quite demanding.
So what options are there to get started more quickly? Wikipedia lists a whole bunch of NMS systems. Having following (and read good things about) Monitorix for some time, it was worth a try.
Setup was pretty painless, but some extra work was needed (as compared to the installation instructions). Good instructions for Debian can be found here though. Worth noting that I decided to install packages from a repository, rather than as a downloaded package, or from source.
1
Add the needed sources. Good instructions here. I stored the repo key in /root, there is probably a better place for it… Btw you need to do the following as root, so run “su” to change user.
Use your editor of choice to edit /etc/apt/sources.list so it looks something like this (the last two lines are what we are after here):
deb http://apt.readynas.com/packages/readynasos 6.0.8 updates apps maindeb http://mirrors.kernel.org/debian wheezy main
# Monitorix packagesdeb http://apt.izzysoft.de/ubuntu generic universe
2
Get the key for the repository. This is needed in order to install the package from the repo.
wget http://apt.izzysoft.de/izzysoft.asc
apt-key add izzysoft.asc
3
Install…
apt-get update
apt-get install monitorix
4
In spite of what the Monitorix install instruction says about the system running out of the box, I had to do some additional changes:As Monitorix will run on the RN312, but you will access it from some other computer, you need to tell Apache2 that this is ok. Edit /etc/apache2/conf.d/monitorix.conf so that it looks like this (only the Directory section show to keep it short):
<Directory /usr/share/monitorix/cgi/>
DirectoryIndex monitorix.cgi
Options ExecCGI
Order Deny,Allow
Deny from all
Allow from all
</Directory>
Yes…. You should probably not allow anyone to access via insecure http… Better option might be to use specific IP numbers, instead of all. I.e. “Allow from w.x.y.z” instead of “Allow from all”.
Edit /etc/monitorix.conf. By default Monitorix’ own http server is enabled, but it will clash with the Apache2 server that is already running on the RN312. We need to disable Monitorix’ http server, and while we are at it, you might also want to change the hostname, as well as decide which graphs to show.
The first part of my /etc/monitorix.conf looks like this
# Monitorix – configuration file
#
# See monitorix.conf(5) manpage for a detailed description of each option.
#

title = Place a title here
hostname = RN312
theme_color = black
refresh_rate = 150
iface_mode = graph
enable_zoom = y
netstats_in_bps = n
disable_javascript_void = n
temperature_scale = c

base_dir = /usr/share/monitorix/
base_lib = /var/lib/monitorix/
base_url = /monitorix
base_cgi = /monitorix-cgi

<httpd_builtin>
enabled = n
host =
port = 8080
user = nobody
group = nogroup
log_file = /var/log/monitorix-httpd
hosts_deny =
hosts_allow =
<auth>
enabled = n
msg = Monitorix: Restricted access
htpasswd = /var/lib/monitorix/htpasswd
</auth>
</httpd_builtin>
# Log files pathnames
# —————————————————————————–
log_file = /var/log/monitorix
secure_log = /var/log/secure
mail_log = /var/log/maillog
milter_gl = /var/milter-greylist/greylist.db
imap_log = /var/log/imap
hylafax_log = /var/spool/hylafax/etc/xferfaxlog
cups_log = /var/log/cups/page_log
ftp_log = /var/log/proftpd/access.log
fail2ban_log = /var/log/fail2ban.log
spamassassin_log = /var/log/maillog
clamav_log = /var/log/clamav/clamav.log
cg_logdir = /var/CommuniGate/SystemLogs/
squid_log = /var/log/squid/access.log

imap_log_date_format = %b %d
secure_log_date_format = %b %e

# Graphs (de)activation
# —————————————————————————–
<graph_enable>
system = y
kern = y
proc = y
hptemp = n
lmsens = y
nvidia = n
disk = n
fs = y
net = y
serv = y
mail = y
port = y
user = y
ftp = y
apache = y
nginx = n
lighttpd = n
mysql = y
squid = n
nfss = y
nfsc = y
bind = y
ntp = y
fail2ban = y
icecast = n
raspberrypi = n
int = y
</graph_enable>
Finally, for some reason the rights to Monitorix’ imgs directory were incorrect out-of-the-box. Fix it:
cd /usr/share/monitorix/
ls -la
chown -R admin:admin imgs
ls -la
5
Almost there… We just need to restart Apache2 and Monitorix to make the new configuration take effect:
service apache2 reload
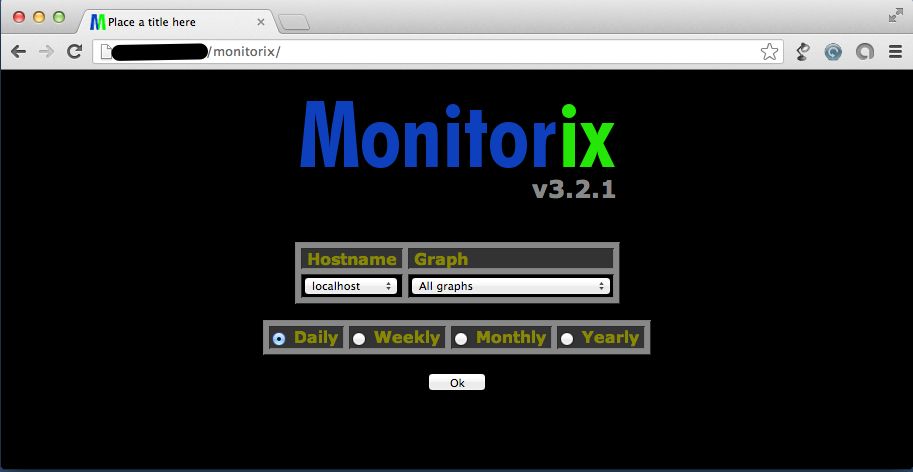
service monitorix restartDirecting your browser to http://<IP of your NAS>/monitorix should now give you a screen like this:
Clicking ok should now take you to a page looking similar to this one (exactly what is shown will depend on the settings you did in /etc/monitorix.conf):
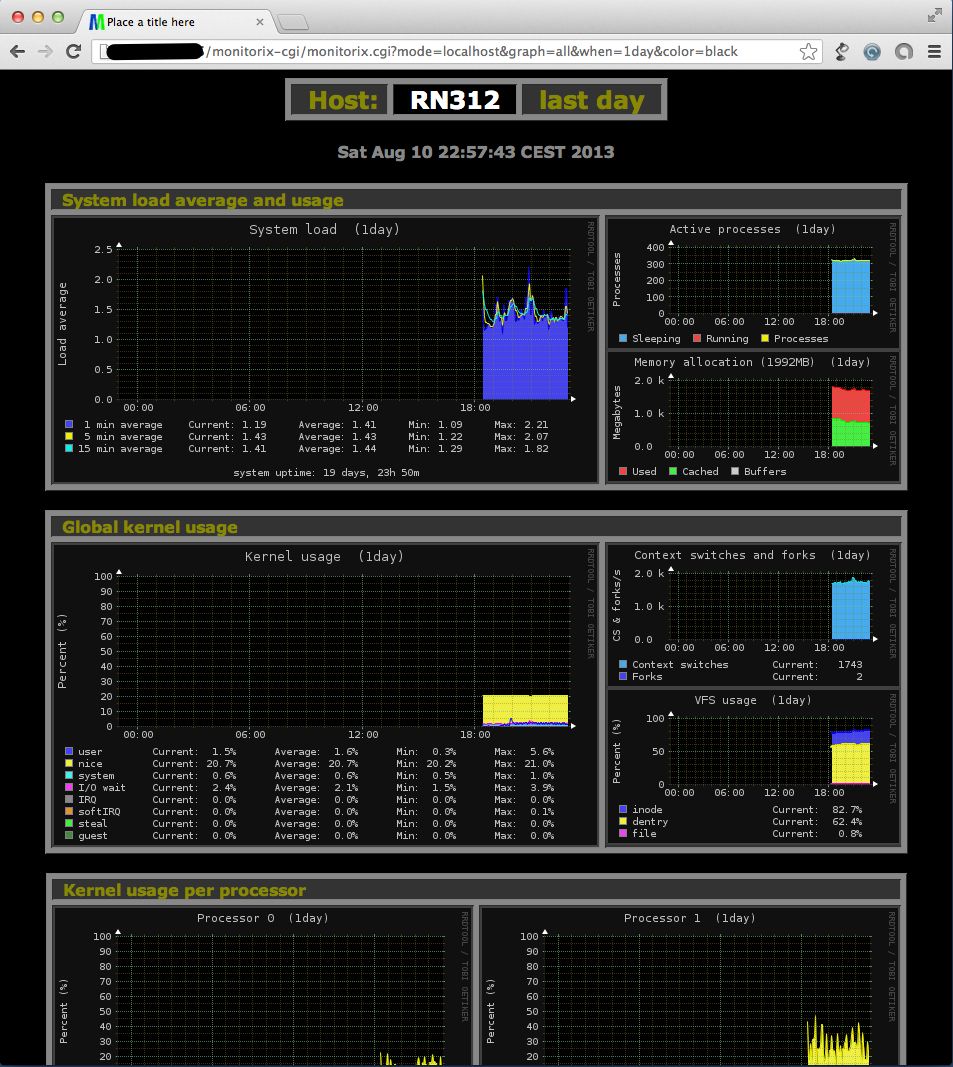
All in all – very nice!