If you don't measure it, you can't improve it: DevOps concepts meets Qlik Sense

Butler SOS 4.0 is out, adding features that make it easier than ever to monitor large Qlik Sense environments. We’ll return to this topic of course, but let’s first take a few steps back.
There are many variants of that quote: “If you can’t measure it, you can’t improve it”, “Measure what matters”, “Measure what is measurable, and make measurable what is not so.” and others. The last one supposedly originates with Galileo Galilei. Smart guy.
The development of Butler SOS continues in that spirit. Qlik Sense provides an awesome platform on top of which all kinds of data analysis, visualisation and presentation solutions can be built. A key word there is platform. Sense does not offer solutions to all software development challenges, nor should it. Instead, use the tools and best practices that millions of developers around the world have refined over the years.
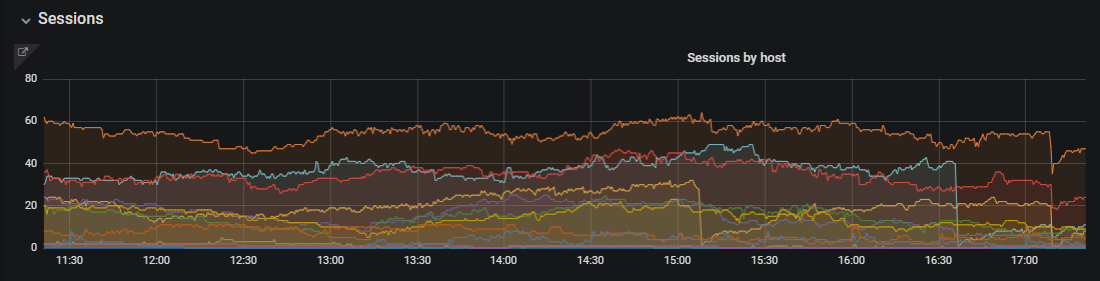
Qlik Sense does on the other hand offer a very comprehensive set of APIs that give developers access to its internals – and this is part of why it’s such a powerful platform. Butler SOS taps into some of these APIs, exposing their data in the form of real-time dashboards, charts and alerts. Suddenly sysadmins know can get both an overview of how all servers are doing, as well as look at detailed server metrics when so needed.
All made possible using the Sense APIs, but in general powered by various open source tools.
We’re basically back to Galileo – let’s make sure the important parts of Qlik Sense are measurable. It is then possible to improve the parts that don’t work well.
For the impatient: download instructions
Get the latest version from the releases page over at Github.
Don’t download the master branch from Github – it might be in active development and do unexpected things…
Butler 4.0 – let’s go BIG!
The wish list of things to include in a monitoring tool like Butler SOS is long. Ideally it should include everything from all the other great tools that are available out there. For example, the standard (included in Sense Enterprise) Operations Monitor app enable retrospective analysis of what happened yesterday/last week/last month, and compare trends over time. The Telemetry Dashboard tool provides chart-level performance metrics – extremely useful when analysis the behaviour of rouge/misbehaving apps, for example.
Butler SOS has during the past few years tried to fill the niche of real-time monitoring, alerting and notification, i.e. making sure that the people responsible for the Sense platform are the first to know when something breaks.
Too often the other way around is the reality: end users tell the platform team that something is not working as intended. Not good.
It has however been tricky to scale Butler SOS to large Sense environments.
Version 4.0 adds features to address this:
- Improved tagging of data. Data can now be tagged with any number of user defined tags. This makes it possible to create much more complex and refined dashboards in Grafana.
- More configurable logging. Sometimes detailed logs are needed, sometimes not. Version 4.0 adds logging to disk at a configurable detail level, with log files rotated daily.
- Control what data (errors and/or warnings and/or info messages) is extracted from the Qlik Sense log database. Again, sometimes more detailed information is needed – in those cases you configure Butler SOS to extract and present also INFO level log messages from Sense.
Configurable tags
Item 1 above is especially interesting, as it makes it easier to monitor large Qlik Sense environments. The idea is simple: each monitored Sense server can be tagged with zero or more tags.
For example, let’s say we have 7 servers.
1 central node, 2 development nodes, 2 test/qa nodes and 2 production nodes.
Also let’s assume that we want to track where the servers are located physically, as well as what brand the servers are. Tags can be used to do this – and the really good part is that the tags can later be used in Grafana, to create dashboards based on the tags!
| Server name | Role | Location | Brand |
| CENTRAL | dev, qa, prod | London | HP |
| DEV1 | dev | London | HP |
| DEV2 | dev | Paris | Dell |
| QA1 | qa | London | HP |
| QA2 | qa | Paris | IBM |
| PROD1 | prod | London | HP |
| PROD2 | prod | Paris | Dell |
With this data defined in an easy-to-read YAML config file, the Grafana dashboards can be instantly filtered to “show real-time metrics for all our Dell servers”, or answer the question “how is our Paris based Sense cluster doing?”.
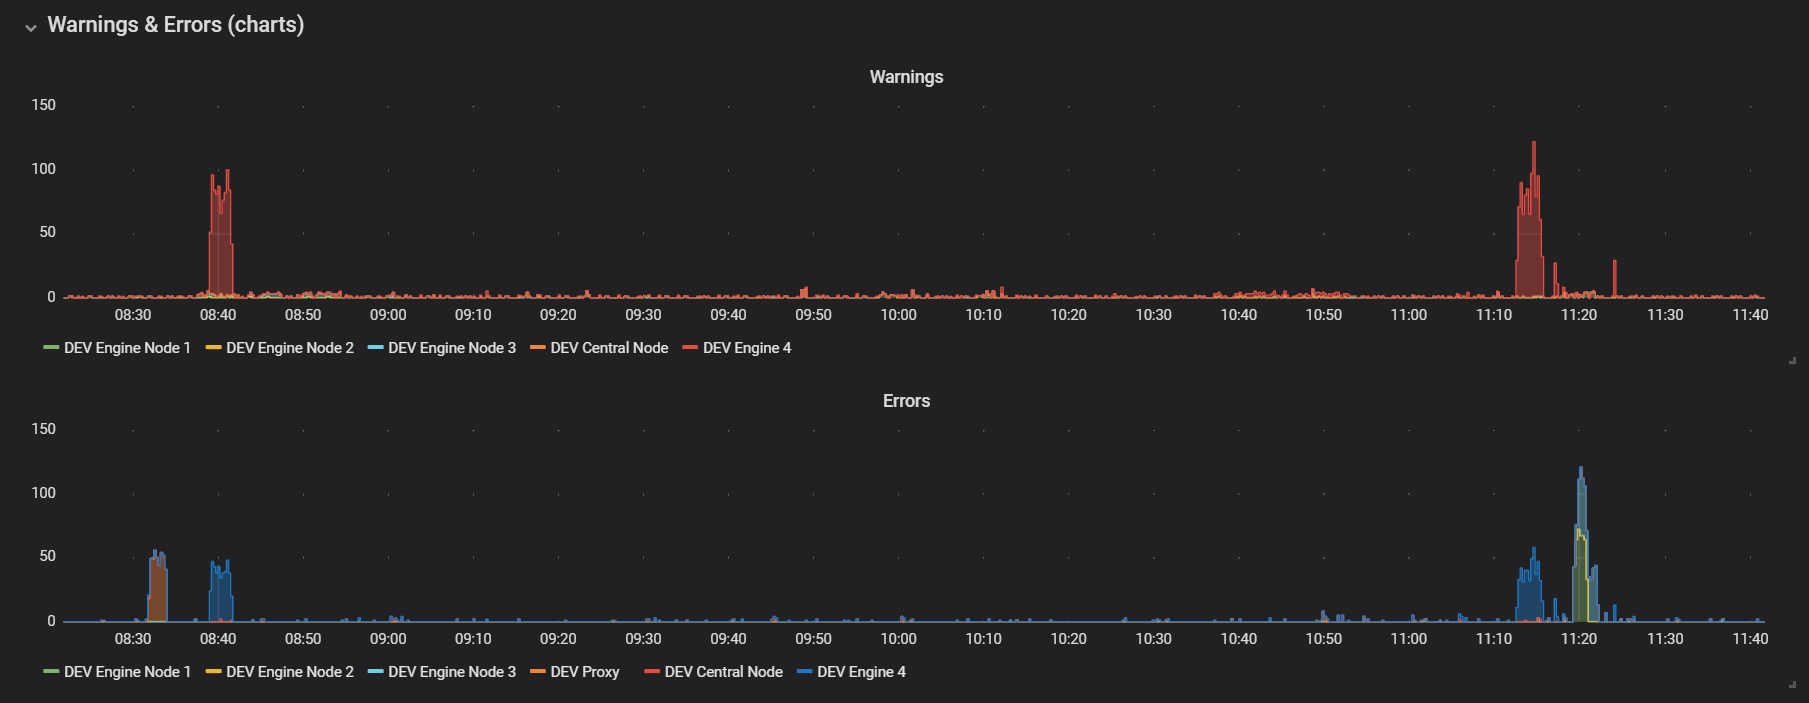
Maybe presenting this as a chart showing warnings and errors for the various servers?
Alert notifications to Slack, Teams etc
A common question about Butler SOS is whether it can send alerts when some condition go out of bound. For example when number of user sessions suddenly drop quickly (indicating some issue with a Sense server), or when number of loaded apps pass some threshold.
The answer is a solid yes!
The notifications and alerting feature uses Grafana’s ditto features, full documentation available here.
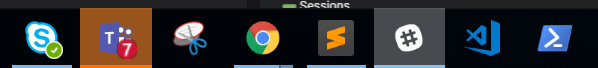
As an example, alerts sent to Office365 Teams would look like below – i.e. just like any other Teams messages:
Commercial plug..
Everything about Butler SOS is open source, simply because the tool is entirely built using open source tools.
That said, Ptarmigan Labs offers consulting services around bringing DevOps concepts to Qlik Sense in general, and the entire family of Butler tools in particular. You reach us at info <at> ptarmiganlabs <dot> com. Let’s talk!